Entitlements, Slow Growth, & Deficits
Reading this post by David Merkel got me wondering about how the economic crisis might affect the long-term solvency of Social Security & Medicare. In particular, Merkel observed:
As for the economic assumptions that Social Security uses, I think they are still optimistic. One thing I have learned about cash flow modeling is that though the averages matter, the early years matter the most. There is more time for their results to compound with interest. / We could have two more bad years (flat/down GDP on average)….
Apropos Merkel’s first point, it’s interesting to compare the growth assumptions for real GDP in SSA’s “Intermediate” case and those from CBO:
![]() As for Merkel’s second point…after trawling through the tables of SSA’s most recent trust fund report, I dumped some of those stats into Excel, fiddled with the economic assumptions, and generated a few pretty graphs.
As for Merkel’s second point…after trawling through the tables of SSA’s most recent trust fund report, I dumped some of those stats into Excel, fiddled with the economic assumptions, and generated a few pretty graphs.
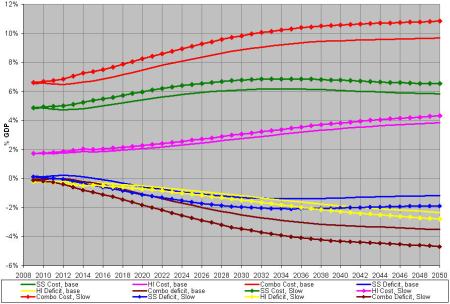
In Figs. 1-2, “Cost” denotes the aggregate cost of a program (OASDI or DI); “deficit” is the difference between that program’s outlays & its tax income. “Combo” denotes the combined cost or deficit for both OASDI & HI. “SS” = OASDI; “HI” = Medicare.
Fig. 1 – Intermediate Cases
Fig. 2 – Pessimistic Cases
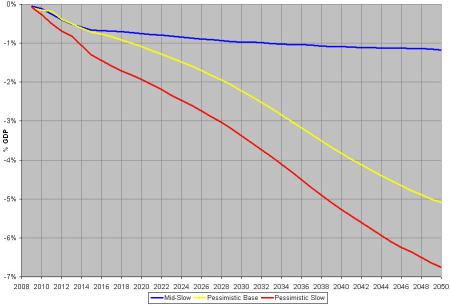
Figure 3 plots the how much larger the “Combo deficit” is, relative to SSA’s “Intermediate” case, for each of three pessimistic cases. (“Mid Slow” corresponds to the “slow” case of Fig. 1; “Pessimistic Base” & “Pessimistic Slow” are the “base” & “slow” cases of Fig. 2.)
Fig. 3
Merkel’s right – a year (or two) of slower initial growth does make a bit of difference. That’s not encouraging….
Notes:
The “base” in each of Figs. 1 & 2 corresponds, respectively, to SSA’s “Intermediate” and “High” scenarios (note that “high” denotes “high cost”, and hence is SSA’s pessimistic scenario).
For the “slow” scenario in Fig. 1, real GDP growth was assumed to be -3% in 2009, & 1.5% in 2010 (as in CBO’s projections), with 2% growth thereafter ’till 2015, at which point annual growth was assumed to be the same as in SSA’s “Intermediate” case. For the “slow” scenario in Fig. 2, real GDP growth was assumed to be -3% in 2009, 0% in 2010, & 1% in 2011; for subsequent years, growth was the same as in SSA’s “High” scenario.
Annual change in real GDP was taken from Table V.B2; Ratio of taxable payroll to GDP, from VI.F5; OASDI Cost ($) & HI Cost ($), from VI.F9; GDP price index, from V.B1. I found it necessary to recalculate the income rates for OASDI & HI (as a % of taxable payroll) using dollar amounts for “Taxable Payroll” (calculated as the product of nominal GDP & ratio of taxable payroll to GDP), and “OASDI Cost” & “HI Cost” (from Table VI.F9) for SSA’s “Intermediate” & “High” cases, since income rates from Table VI.F2 didn’t match the aforementioned calculated amounts (not sure how that happened). For each year, the OASDI & HI income rates (as a % of taxable payroll) for the “Mid-slow” and “Pessimistic slow” cases were assumed to be the same as in SSA’s “Intermediate” & “High” cases, respectively; ditto the ratio of taxable payroll to GDP, as well as the nominal dollar cost of both OASDI & HI. For each of the “Mid-slow” and “Pessimistic slow” cases, annual OASDI & HI incomes were recalculated as being the product of nominal GDP, the ratio of taxable payroll to nominal GDP, & the respective income rate for that program (OASDI or HI); for a given year, the deficit for OASDI or HI was the difference between income & cost.


Leave a comment